
What to do?
We have a lot of data!
Your next step
Take stock: list your main data sources and the decisions you most need to support.
Stop wrestling with spreadsheets and start making faster, better decisions. We turn your data into trusted insight, from self-service dashboards to predictive analytics.
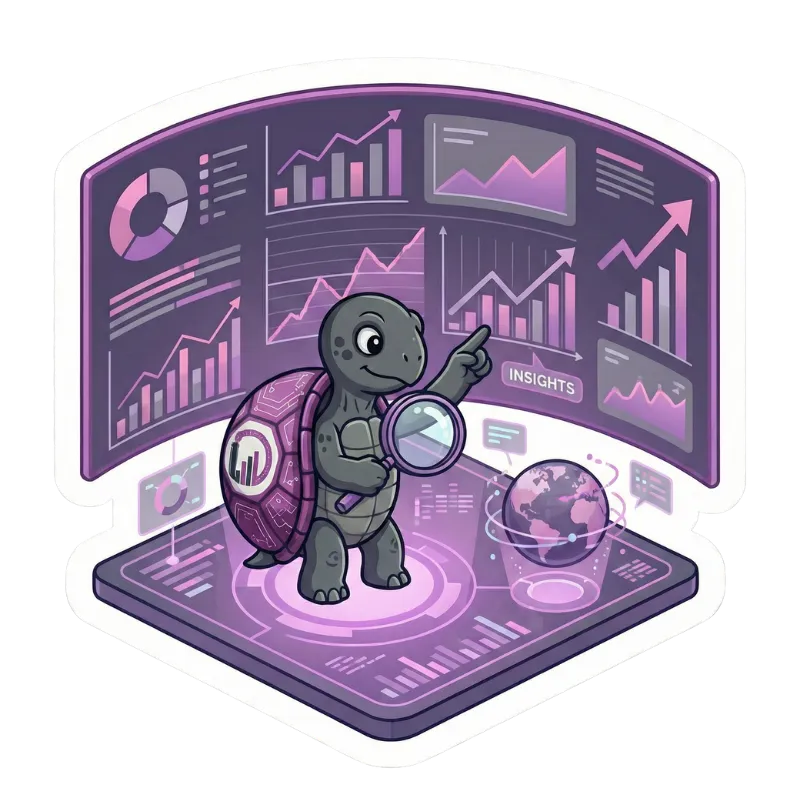
Every organisation sits somewhere on this curve, from having lots of data and no clear use for it, to analytics reshaping how it works. Pick the statement that sounds most like you to see where you are and what comes next.
Which sounds most like you?
We have a lot of data!
Take stock: list your main data sources and the decisions you most need to support.
Data is stored, secured and available.
Turn stored data into one trusted set of reports, starting with the measures leaders ask for most.
Answer, “What happened?”
Automate your reporting and add interactive dashboards, so people can explore when and where, not just what.
Get your score: free 5-minute maturity assessment What we deliver at this stage
Answer, “What happened, when and where?”
Go beyond what happened: add drill-down and statistical analysis to explain why, and to spot trends early.
Get your score: free 5-minute maturity assessment What we deliver at this stage
Answer, “Why?” Questions, “What happens if current trends continue?”
Use your history to forecast. Start with one high-value prediction, such as demand or customer churn.
Get your score: free 5-minute maturity assessment What we deliver at this stage
Illuminate what will happen in the future.
Put predictions to work: model the options and recommend actions, with people still making the call.
Get your score: free 5-minute maturity assessment What we deliver at this stage
Evaluate predicted future alternatives; recommend optimal actions.
Build the recommendations into everyday processes, and measure the improvement they make.
Get your score: free 5-minute maturity assessment What we deliver at this stage
Enabled by analytics-derived insights; transformation underway.
Keep improving: monitor your models, retire what no longer helps, and find the next process to transform.
Find out exactly where you are: free 5-minute maturity assessment
Whether you're starting a data analytics program from the ground up or advancing the one you have, we work with you to make your data and analytics more accessible, reliable and usable across the organisation.
Our team has delivered analytics consulting for more than two decades.
New BI tools and analytics products arrive all the time. We recommend the platform that fits your needs, not simply the newest one.
Every engagement starts with your goals and your data, then focuses on where analytics will make the biggest difference.
Each step answers a harder question and is worth more to the business. We help with every step, starting wherever you are today.
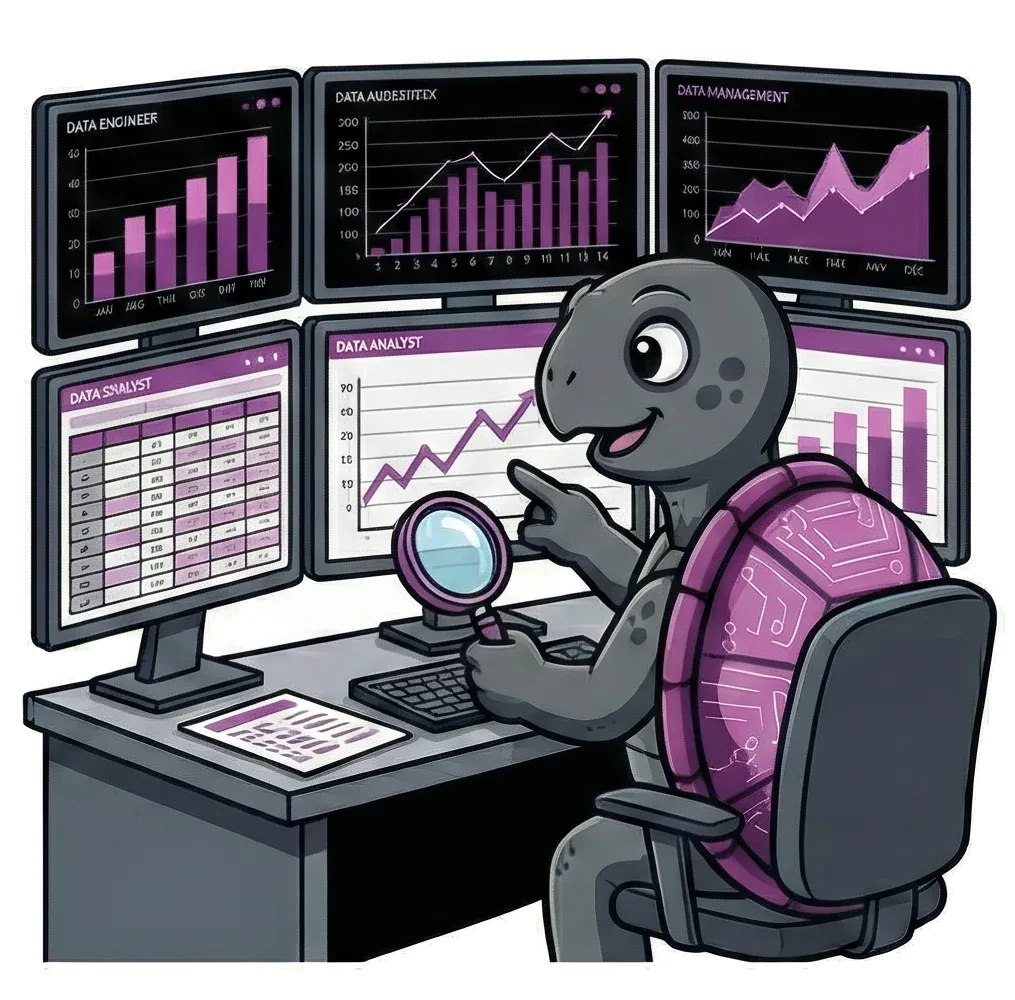
What we deliver: Automated dashboards and reports from one trusted source.
“Which stores missed target last month?”
On the curve: Stages 03–04What we deliver: Drill-down, root-cause and variance analysis that explains the numbers.
“Why did returns rise in March?”
On the curve: Stages 04–05What we deliver: Forecasts and machine learning models, validated against your own history.
“How much stock will we need next quarter?”
On the curve: Stage 06What we deliver: Scenario models and recommendations, so the trade-offs are clear before you decide.
“Which price change best protects our margin?”
On the curve: Stage 07How we work
We pin down the decisions you need to make and the questions behind them.
Includes
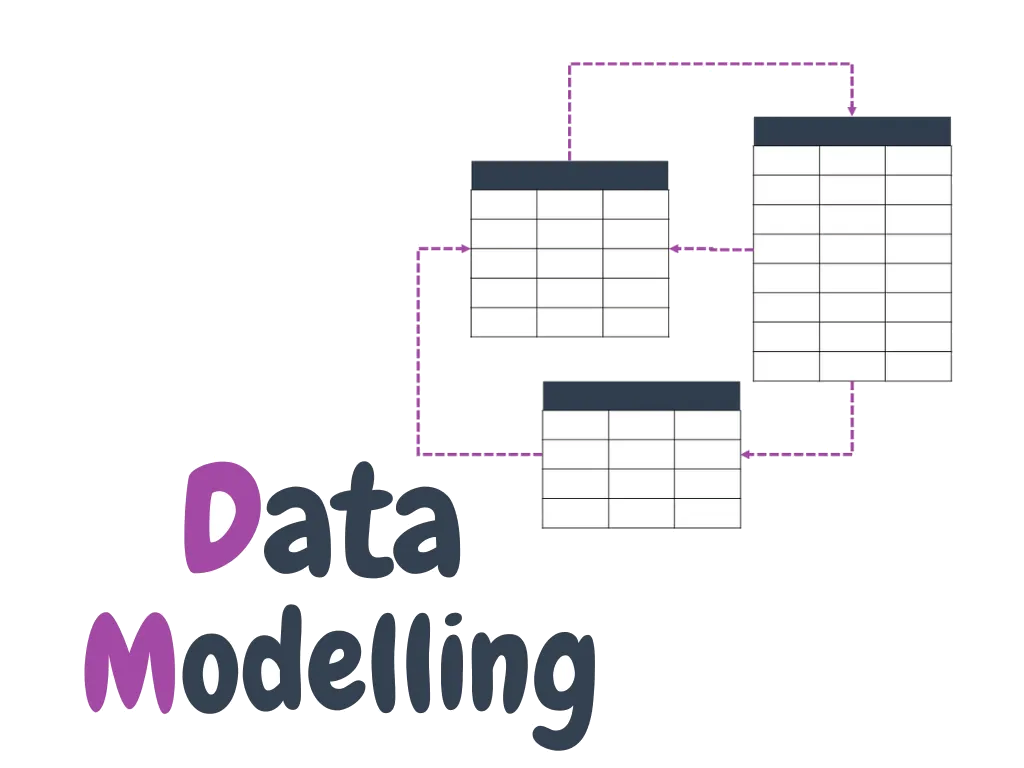
We build a clean, governed data model with agreed definitions.
Includes
We design dashboards and analyses around how your people work.
Includes
We train your users and refine based on real feedback, so the insight gets used.
Includes
How analytics turns everyday data into better decisions, from understanding what happened to predicting what's next.
Facing something similar? Talk to us about your use case.
What our clients say about us
 Kaye Johnston
Director-RIM
Australian Energy Regulator
DATA LEAGUE personnel have developed a reporting interface for Australian Energy Regulator, that will be used to inform future data storage and reporting solutions for the AER. They provided business analyst services, as well as developing the data reporting architecture, documentation, and visualisations. They worked well with my team of subject matter experts, and our on-site IT services teams, and easily managed the challenges of a team in multiple time zones and from various backgrounds. The outcomes of the project was a fully functional Power BI reporting interface, enabling access to raw data, curated metrics and specialist reports that will influence our future data collections, and the underlying database architecture. I am very happy to recommend the team at Data League.
Take our free 5-minute Data Maturity Assessment. You'll get an instant score, a benchmark comparison and the three things to fix first.
Frequently Asked Questions
In today's GenAI digital business world, data analytics can help businesses gain a competitive edge by providing valuable insights into customer behaviour, market trends, and other key factors that can impact business performance.
By leveraging the power of data analytics, businesses can improve operational efficiency, reduce costs, and identify new opportunities for growth and innovation. Data analytics can also help businesses improve customer satisfaction by providing personalised experiences that meet their unique needs and preferences.
You can have analytics without visualisation (a spreadsheet of raw outputs), but it is difficult for a human to interpret quickly. Visualisation makes the analytics consumable.
The analytics process follows a structured lifecycle:
Data analytics consulting offers numerous benefits for businesses, including:
Improved decision-making: By leveraging the power of data analytics, businesses can gain valuable insights into customer behaviour, market trends, and other key factors that can impact business performance. This information can be used to make more informed decisions, reduce costs, and gain a competitive edge in the marketplace.
Increased efficiency: Data analytics can help businesses streamline their operations and identify areas where they can improve efficiency. By analysing data from various sources, businesses can identify bottlenecks, eliminate waste, and optimise their processes to improve productivity and reduce costs.
Better customer experiences: Data analytics can help businesses deliver personalised experiences that meet their customers' unique needs and preferences. By analysing data on customer behaviour and preferences, businesses can tailor their products and services to better meet the needs of their target audience.
Improved risk management: Data analytics can help businesses identify potential risks and take proactive steps to mitigate them. By analysing data on past performance and market trends, businesses can identify potential threats and take steps to minimise their impact.
Increased revenue: Data analytics can help businesses identify new opportunities for growth and innovation. By analysing data on customer behaviour, market trends, and other key factors, businesses can identify new products and services that meet customer needs and drive revenue growth.
Insights & Resources


At DATA LEAGUE, our expert data analytics consulting services can help you leverage the power of data to achieve your business goals. Contact us today to learn more about how we can help you unlock the full potential of your data.