

Benefits of Data Visualisation
When executed effectively, the transformation of your company's data into visualisations yields multiple benefits. Let's dive into this article to learn more.
Data visualisation consulting is essential for Australian organisations to understand their data. Efficiently running your organisation hinges on making sound decisions, a process rooted in thorough research and analysis. Yet, data alone is not enough. It must be meticulously organised and presented to effectively address the critical questions that guide you toward accurate and well-informed decision-making. At DATA LEAGUE, we specialise in providing expert data visualisation consulting services to help businesses gain valuable insights from their data. Our team of experienced data analysts and visualisation experts work with you to create compelling visualisations that are tailored to your business needs.
The human brain is inherently wired to rapidly process and comprehend visualisations far more swiftly than reading and interpreting textual information. So, we believe that data visualisation is more than just creating pretty charts and graphs. Our approach is designed to help you answer your most important business questions by providing you with the insights you need to make informed decisions. We work closely with you to understand your business goals, data sources, and user needs before creating visualisations that are both informative and engaging.

We start by analysing your data to identify key patterns and trends. This allows us to gain an in-depth understanding of your business data and helps us to create visualisations that are both insightful and actionable.
We use our expertise in data visualisation to create custom charts and graphs that are tailored to your business needs. Our visualisations are designed to be easy to understand and to provide valuable insights to your users.
We can help you design and develop custom dashboards that provide an at-a-glance view of your business data. Our dashboards are designed to be interactive, allowing your users to explore your data in real-time.
We can help you tell a story with your data by creating compelling visualisations that highlight key insights and trends. Our visualisations are designed to be engaging and to help your users understand your data in a meaningful way.
When executed effectively, the transformation of your company's data into visualisations yields the capability to:
Our consultants are dedicated to a singular mission: assisting you in maximising the potential of your data. This entails ensuring you possess the appropriate tools and expertise to streamline the process of navigating your data effortlessly.
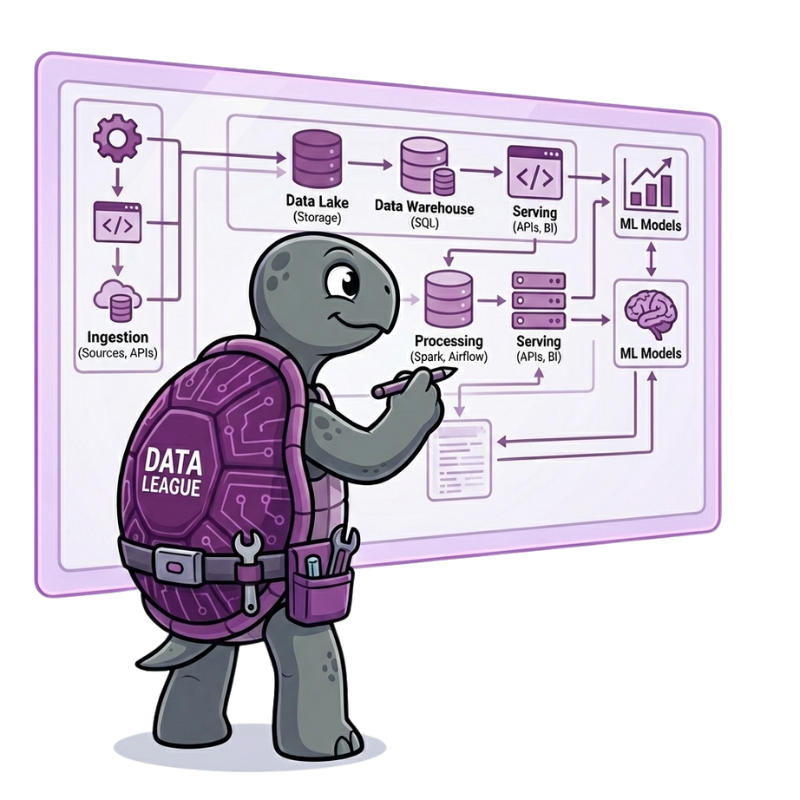
We have meticulously crafted reusable frameworks for both ELT (Extract, Load, Transform) and ETL (Extract, Transform, Load) paradigms. These robust frameworks empower us to expediently implement consistent naming conventions, traceable processes, and easily comprehensible data lineage throughout the data ingestion pipeline.we can swiftly configure data pipelines tailored to your specific requirements. This agility allows us to adapt to evolving data needs, maintain data governance standards, and provide you with a clear and transparent view of your data's journey within your organisation.
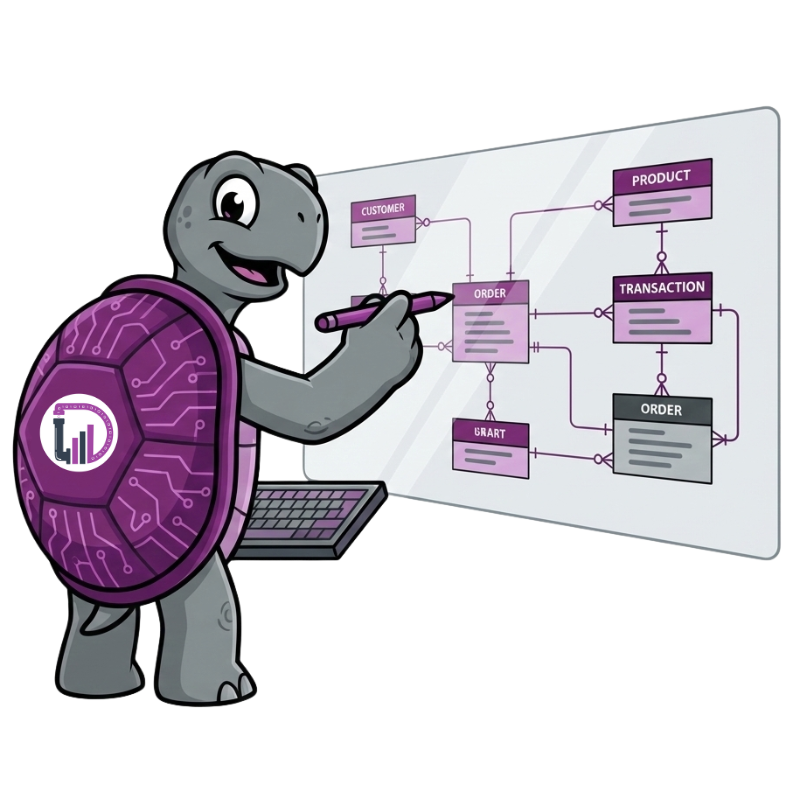
Data Modelling is the process of creating a conceptual representation of data. It is a crucial aspect of data strategy consulting, as it enables businesses to gain a deeper understanding of their data. At DATA LEAGUE, we offer expert data modelling services to help businesses create comprehensive data models that accurately represent their data. Our data modelling services enable businesses to identify patterns, trends, and relationships in their data, which helps them make informed decisions and improve operational efficiency.
We take the time to deeply understand your business, Key Performance Indicators (KPIs), and the factors driving your business. This knowledge forms the foundation for crafting intuitive dashboards and interactive reporting solutions that unlock fresh insights from your data. Additionally, we conduct comprehensive health assessments of your existing implementations, offering tailored recommendations to enhance performance and elevate the quality of your reporting.
Our consultants are extensively trained in the deployment of enterprise-wide data analytics solutions and the optimisation of existing implementations. Our capabilities encompass full-scale deployments, customised solutions, report automation, technical upgrades, configurations, and the design of self-service solutions across your organisation.

We provide tailored training and mentoring services for your Business Intelligence (BI) tools, equipping your team with the knowledge required for success and productivity. Complemented by a comprehensive user adoption plan, we ensure that you maximise the return on your BI tool investment.

DATA LEAGUE personnel have developed a reporting interface for Australian Energy Regulator, that will be used to inform future data storage and reporting solutions for the AER. They provided business analyst services, as well as developing the data reporting architecture, documentation, and visualisations. They worked well with my team of subject matter experts, and our on-site IT services teams, and easily managed the challenges of a team in multiple time zones and from various backgrounds. The outcomes of the project was a fully functional Power BI reporting interface, enabling access to raw data, curated metrics and specialist reports that will influence our future data collections, and the underlying database architecture. I am very happy to recommend the team at Data League.
Frequently Asked Questions
Data visualisation is a powerful tool that can help organisations across various domains to gain valuable insights from their data and make better-informed business decisions.
Enhanced Understanding: Data visualisation presents complex data in a visual format, making it easier to comprehend patterns, trends, and insights. Visual representations enable users to grasp information quickly and make informed decisions.
Improved Decision-Making: By converting raw data into visual charts, graphs, and dashboards, data visualisation enables data-driven decision-making. It helps stakeholders identify opportunities, detect anomalies, and respond to challenges effectively.
Faster Data Analysis: Visualising data allows analysts and decision-makers to process information more rapidly than they could with raw data alone. It reduces the time spent on manual data analysis and enables real-time or near-real-time insights.
Identifying Patterns and Trends: Data visualisations help uncover hidden patterns and trends in data that might not be apparent in tabular form. This aids in discovering correlations, seasonality, and other valuable insights that inform business strategies.
Effective Communication: Visualisations make data communication more engaging and impactful. Complex data can be presented in a simple and visually appealing manner, allowing stakeholders to share information effectively across teams and departments.
Increased Stakeholder Engagement: Data visualisations encourage active participation and engagement from stakeholders. Interactive visualisations allow users to explore the data, filter information, and gain a deeper understanding of the underlying insights.
Storytelling with Data: Data visualisations enable the creation of data stories, where information is presented in a narrative format. Storytelling with data fosters a stronger emotional connection to the insights and helps communicate the data's significance.
Early Detection of Issues: Visualising data in real-time or at regular intervals can help identify potential issues or anomalies promptly. Early detection allows organisations to take proactive measures to address problems and avoid potential risks.
Effective Presentations and Reports: Incorporating data visualisations in presentations and reports enhances their impact and persuasiveness. Visuals facilitate clear communication of data findings, improving the audience's understanding and retention.
Cross-Domain Insights: Data visualisation allows users to combine and analyse data from multiple sources and domains. This cross-domain perspective provides a comprehensive view, facilitating a more holistic understanding of the business landscape.
Performance Monitoring: Visual dashboards enable organisations to monitor key performance indicators (KPIs) and metrics in real-time. This constant monitoring helps in tracking progress toward goals and taking timely corrective actions.
In conclusion, data visualisation is a powerful tool that offers various benefits, ranging from increased data understanding and effective decision-making to improved communication and engagement. By leveraging data visualisation techniques, organisations can derive actionable insights from their data and drive business success.
Insights & Resources
When executed effectively, the transformation of your company's data into visualisations yields multiple benefits. Let's dive into this article to learn more.
Whether you're presenting insights to your team, clients, or stakeholders, well-crafted Visualisations can turn complex data into a clear and compelling story.
Looking for expert data visualisation consulting services in Australia? Our team of experienced data analysts and visualisation experts can help you gain valuable insights from your data through advanced data visualisation techniques. Contact us today to speak to a data visualisation expert and learn more about how our services can help your business make better-informed decisions based on data.