Mining is one of Australia's most data-intensive industries. A single site produces data from haul trucks, fixed plant, sensors, drill and blast systems, laboratories, maintenance and safety systems, and that's before finance and supply chain. It arrives in different formats, at different speeds, often from remote locations with limited connectivity.
This guide covers where analytics delivers the most value in mining, the challenges to plan for, and the data engineering practices that make the results reliable.
Where analytics adds value in mining
Predictive maintenance
Combining sensor readings, operating hours and maintenance history helps predict equipment failures before they happen, so maintenance is planned rather than reactive and costly unplanned downtime is reduced.
It usually develops in stages. Start with condition monitoring: thresholds and alerts on key readings, such as temperature, vibration and pressure. Then add anomaly detection that learns each asset's normal behaviour. Finally, build failure prediction models once enough failure history has been captured. Platforms now include parts of this out of the box. Microsoft Fabric's Eventhouse, for example, has built-in anomaly detection that runs directly on live time-series data.
Productivity and operations
Analysing fleet, load and cycle-time data highlights bottlenecks in the load-and-haul process, and shows supervisors performance against plan during the shift, when there's still time to act.
Exploration and geology
Geospatial analysis of drilling, assay and survey data supports resource modelling and helps focus exploration where it's most likely to pay off.
Safety
Bringing together incident reports, inspections, fatigue indicators and operating data helps identify leading indicators of risk, so controls can be strengthened before incidents occur.
Energy, emissions and reporting
Energy and fuel are among the largest operating costs. Analytics shows where consumption can be reduced, and supports emissions reporting and decarbonisation planning.
Reporting is a strong reason to get this data right. Under the National Greenhouse and Energy Reporting (NGER) scheme, administered by the Clean Energy Regulator, a facility must report if it emits 25,000 tonnes or more of CO2-e (scope 1 and scope 2 combined) or produces or consumes 100 terajoules or more of energy in a reporting year. A corporate group must report at 50,000 tonnes or 200 terajoules. Reliable, automated collection of fuel, electricity and production data turns reporting from a yearly scramble into a by-product of everyday analytics.
Environmental performance
Monitoring water, dust, noise and rehabilitation data supports compliance and demonstrates performance to regulators and communities.
Market, pricing and supply chain
Analysing commodity prices, costs and logistics supports better planning, and supply chain analytics keeps critical spares and consumables available without excessive stock.
Challenges to plan for
- Data variety and quality: sensor, operational and manual data arrive in different formats and need cleaning and validation.
- Integration: fleet, plant, maintenance and ERP systems rarely share common identifiers.
- Remote locations: limited connectivity means designing for buffering and catch-up loads.
- Security: operational technology networks need careful protection when connected to analytics platforms. The Australian Signals Directorate's Principles of operational technology cyber security start from the principle that safety is paramount.
- Scale: high-frequency sensor data needs platforms that scale cost-effectively.
- Skills and change: insights only create value when supervisors and planners trust and use them.
Building reliable data foundations
Data engineering turns raw site data into reliable information for production, maintenance and safety decisions. These eight practices make the difference.
1. Collect data reliably at the source
Identify the systems that matter for your priority decisions, and capture data as close to the source as possible. Plan for patchy connectivity at remote sites with local buffering and catch-up loads, so data isn't lost when the link drops.
2. Clean and validate early
Sensor feeds contain gaps, spikes and stuck values, and manual entries contain typos. Apply validation rules as data lands, such as valid ranges, timestamps and duplicates, and flag problems rather than silently dropping records.
3. Transform into a shared model
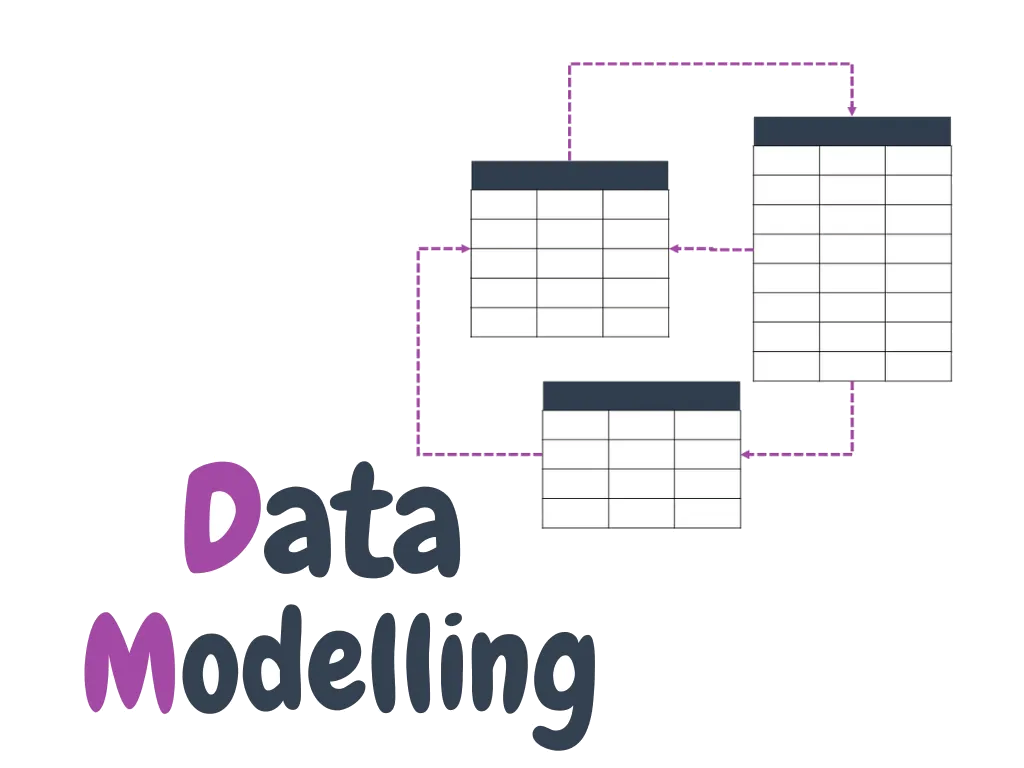
Different systems describe the same equipment, locations and shifts in different ways. Map them to shared reference data (an equipment register, a site and pit hierarchy, a shift calendar) so measures such as availability, utilisation and tonnes are calculated the same way everywhere.
4. Store data in a modern platform
A lakehouse on Microsoft Fabric or Databricks can hold high-volume time series alongside operational and financial data. A medallion architecture keeps the history while giving analysts trusted tables to work from. It's Microsoft's recommended design for Fabric, and it has three layers:
- Bronze (raw): data stored exactly as it arrives, unchanged, so the original is always available as the source of truth.
- Silver (enriched): errors fixed, formats standardised and duplicates removed. For a mine, this is where equipment codes are matched to the equipment register and timestamps aligned to site time and shifts.
- Gold (curated): organised for reports and dashboards, such as daily production, equipment availability or maintenance backlog.
Microsoft recommends keeping each layer in its own lakehouse (or warehouse) and, ideally, its own workspace for better control and governance, with Delta tables in the silver and gold layers.
5. Handle streaming data as a stream
Not everything should wait for a nightly load. Conveyor, pump, crusher and fleet telemetry is most useful while it's happening. In Microsoft Fabric, Real-Time Intelligence is built for this:
- Eventstreams collect, transform and route streaming data without code, with connectors including Azure IoT Hub, Apache Kafka and MQTT.
- Eventhouses store time-based event data for fast queries in KQL (or T-SQL), and include built-in anomaly detection that runs directly on live time series.
- Activator watches the data and takes action when a condition is met, such as alerting a maintenance planner when a bearing temperature trends above its limit.
The same data can then flow into the lakehouse for longer-term analysis alongside maintenance and production history.
6. Integrate and analyse
Bring production, maintenance, safety and cost data together to answer cross-functional questions: which equipment failures cost the most production, or how weather affects haulage. Dashboards in Power BI put this in front of supervisors and managers, ideally within the shift.
7. Protect operational technology
Mine sites run operational technology (OT): the control systems behind plant, processing and fleet. Connecting it to analytics platforms must never create a new path into those systems. The Australian Signals Directorate's Principles of operational technology cyber security, published with international partners, are a sound basis for those decisions. Their first principle is that safety is paramount, and they go on to cover knowledge of the business, protecting OT data, segregating OT networks, supply chain security and people. Bring OT and security teams into the design from the start.
8. Automate, monitor and maintain
Schedule pipelines, alert on failures and track data freshness and quality. Use version control and automated deployment so changes are safe, and document everything so the platform doesn't depend on one person.
Getting started
Start with one high-value question, such as the main causes of unplanned downtime, and build the data foundations to answer it well. To see the kind of reporting this enables, explore the mining operations dashboard in our live dashboard showcase.
If you're building on Microsoft Fabric, our Fabric Accelerator sets up the medallion lakehouse, pipelines and security in four phases of up to a week each. Or book a 30-minute call with one of our consultants to talk through your site's data.